Chart-GPT is an online tool that allows you to generate beautiful charts on demand in response to natural language queries or inputs.
Built using React, Next.js, OpenAI, and Tailwind CSS.
Deploy:
1. Clone the Chart-GPT GitHub repository:
git clone https://github.com/whoiskatrin/chart-gpt.git
2. Create an .env file with your OpenAI API key:
cp .env.example .env
OPENAI_API_KEY="your-api-key"
3. Install the required dependencies:
npm install
# or
yarn
4. Start the local development server; then the app will run at http://localhost:3000.
npm run dev
# or
yarn dev
How to use it:
1. Run the app or visit https://www.chartgpt.dev/
2. Describe the type of chart you want to see – such as a bar chart, pie chart, or line graph – and input the data or labels you wish to visualize.
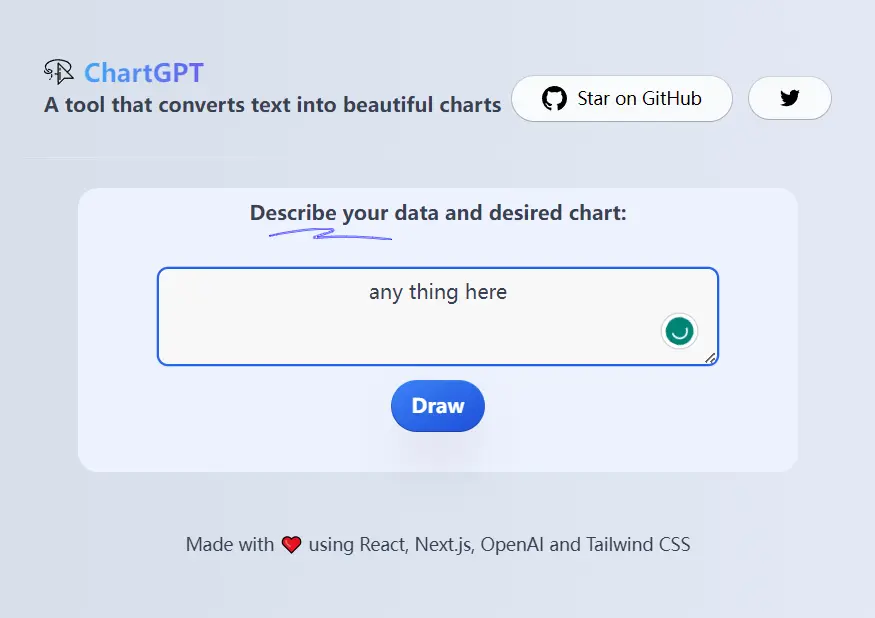
3. Click the Draw button to generate charts.