AI Graph Maker is a free tool that transforms raw data into insightful and professional charts & graphs. It is designed to help data analysts, business professionals, and researchers create precise data visualizations without technical expertise.
You input your data, specify your preferred chart type, and AI Graph Maker generates an appropriate visualization that clearly communicates your insights.
Case Studies
I tested AI Graph Maker with three different scenarios to evaluate its capabilities:
Sales Data Visualization
For quarterly sales analysis, I input data for four products across four quarters. The tool generated a bar chart that clearly displayed sales trends, making it simple to identify Product C as the top performer.

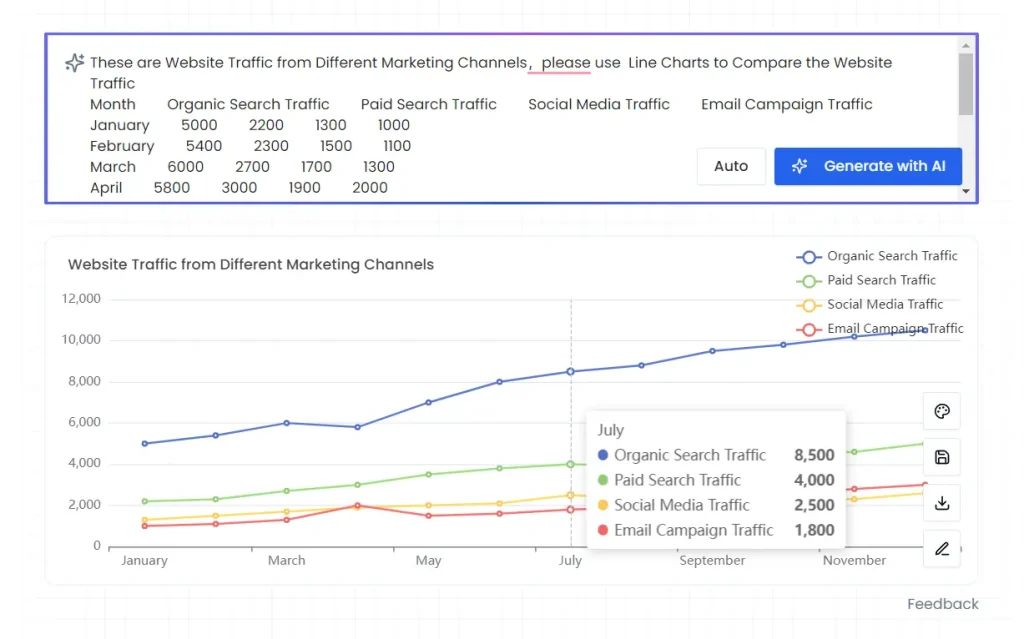
Marketing Channel Analysis
I provided website traffic data from various marketing channels over 12 months. The resulting line chart effectively showed organic search traffic leading growth, reaching 10,500 visitors by December.
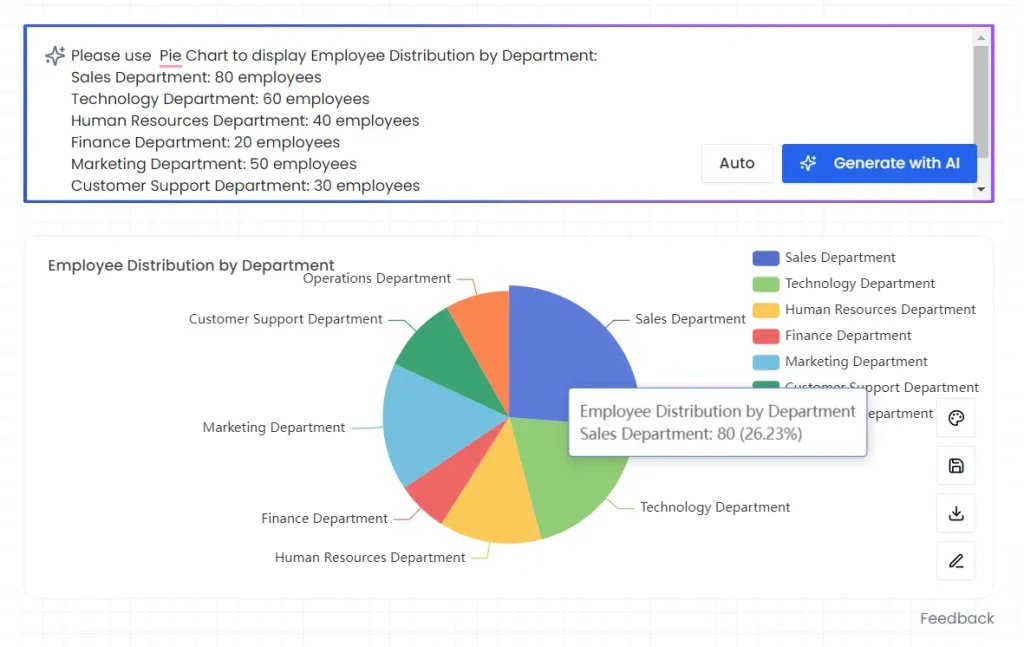
Department Distribution
Using employee distribution data across seven departments, the tool created a pie chart that highlighted Sales (80 employees) and Technology (60 employees) as the largest departments.
Supported Chart Types:
- Bar charts for comparing quantities
- Line graphs for tracking trends
- Pie charts for showing proportions
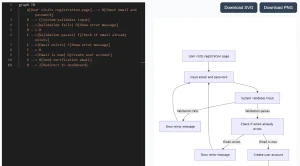
- Flowcharts for process visualization
- Timeline charts for project planning
- ER diagrams for database modeling
- Mind maps for brainstorming
- Gantt charts for project scheduling
Use Cases
- Business Reports: Visualize sales data, market trends, or financial performance for clear stakeholder communication.
- Website Analytics: Present website traffic, user engagement, or conversion rates using line graphs to track performance over time.
- Survey Results: Summarize survey findings with pie charts or bar graphs to highlight key insights.
- Educational Presentations: Illustrate statistical data or concepts visually for students or audiences.
- Project Management: Use Gantt charts to outline project timelines, tasks, and dependencies.
How To Use it
- Go to the Free AI Graph Maker website.
- Describe the type of chart you need and provide your data.
- Click the ‘Generate Button’. The AI will analyze your data and create a suitable graph.
- Adjust the content, style, and colors to fit your needs. You can modify labels, titles, and colors.
- Export your finished graph in PNG format.
Pros
- Instant chart generation
- No coding required
- Free access
Cons
- Limited advanced customization options
- Fixed chart template options
- Basic animation capabilities
Frequently Asked Questions
Q: Does AI Graph Maker require coding knowledge?
A: No coding skills needed. The platform handles all technical aspects automatically.
Q: Can I edit my charts after generation?
A: Yes, you can modify colors, labels, and data points after initial creation.
Q: Does the tool support large datasets?
A: While the tool handles most datasets well, it may struggle with very large or complex data inputs.