VizGPT is an open-source AI data visualization tool that simplifies the process of turning data into meaningful visualizations.
It uses OpenAI’s GPT model to generate charts, graphs, and other visuals by describing what you want in natural language. You can then refine it by chatting further, without needing to write complex code.
How to use it:
1. Visit the VizGPT app.
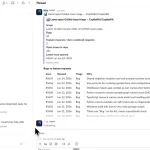
2. Click on the Upload CSV Data button to upload your data. Once uploaded, you can view or modify your data’s meta information in the data view section. While VizGPT will automatically infer these metas, you have the flexibility to edit them for more accurate visualizations.

3. Engage in a conversation with your data. Simply type in what kind of visualization you’re aiming for, and let VizGPT handle the rest.